(Unused) End-to-End Testing
Testing the Conversion Tracking Tag
The impact.com Conversion tag needs to meet certain requirements to function correctly. It requires the Universal Tracking Tag to load first (custom UTT loaded event trigger), and it needs to fire on the order confirmation page only (Some Page Views trigger).
To recreate the above-mentioned conditions, you'll need to place a test transaction. Follow the customer journey by completing an online sale conversion. You will be able to reverse or modify any test transactions within your impact.com account.
Note!You are welcome to test through preview on your end, however, impact.com will test a deployed solution on either staging or production sites and the final validation must take place on a deployed production solution.
Follow the instructions below to test the impact.com conversion tracking:
- Within your GTM container, select Preview.
- Navigate to the website where you have placed your tags.
- Open your developer tools in your browser.
- Follow the same journey your customer would by completing an online sale conversion.
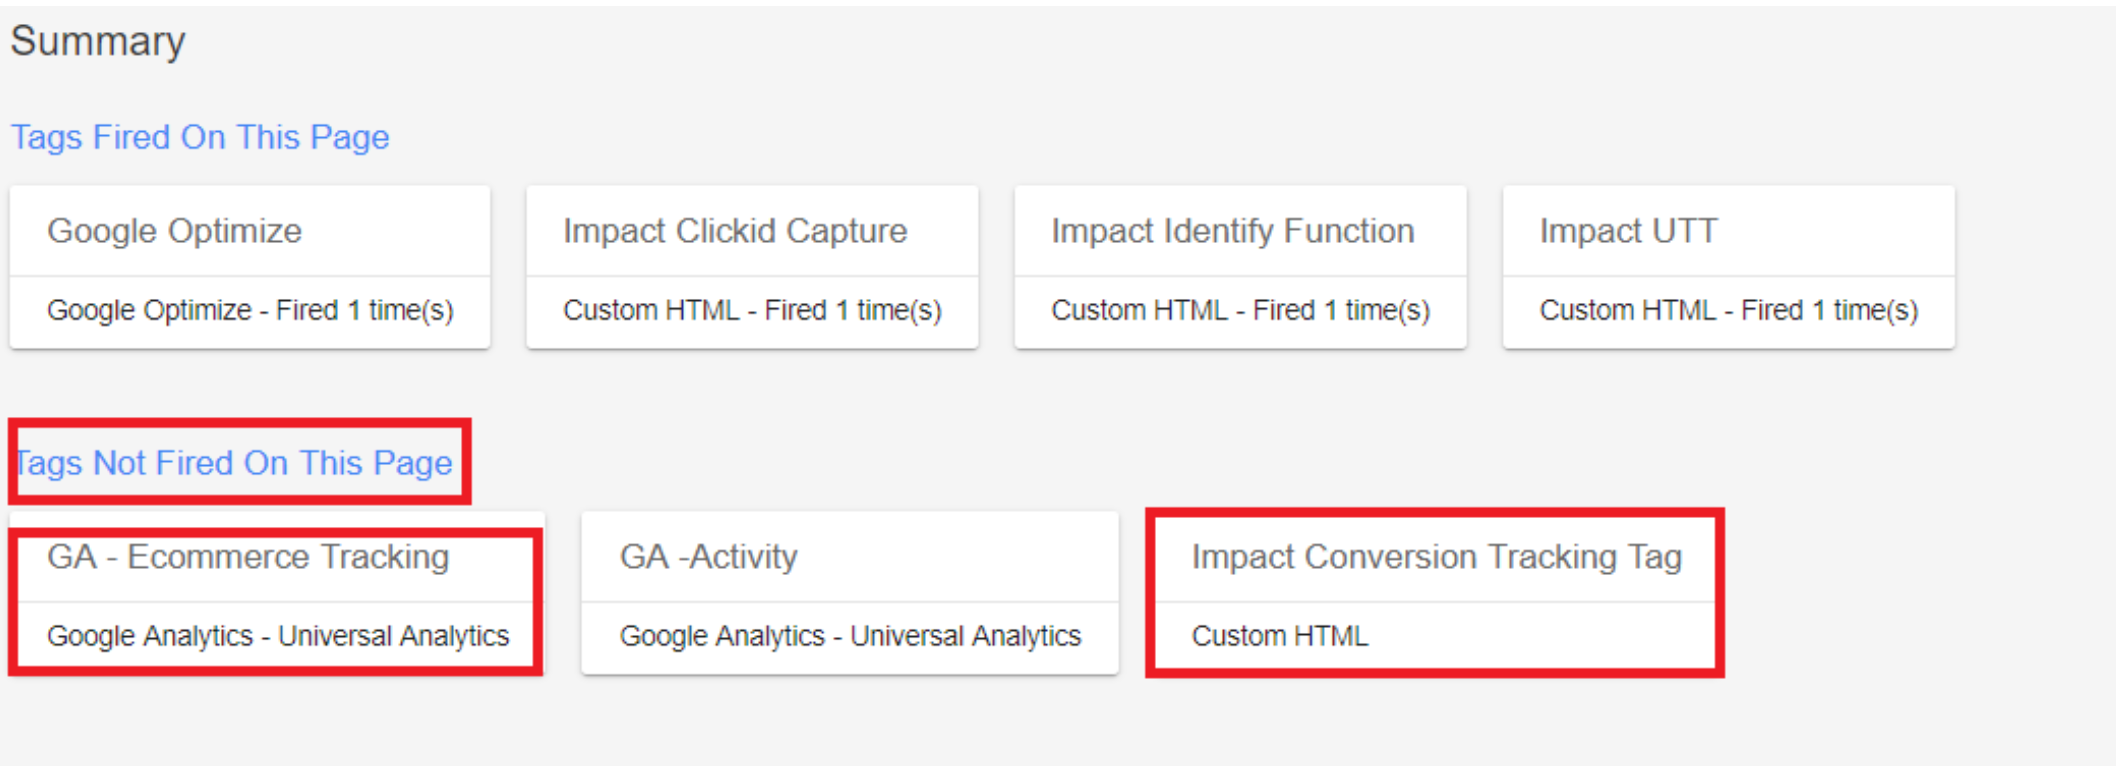
- When you land on the order confirmation page, you should see the impact.com Universal Tracking Tag, as well as the impact.com Conversion Tracking Tag under the Tags Fired on this Page section of the GTM debugs console.
- Select a tag to view its information. The script should be populated with your order and item level details, as well as custom endpoints.
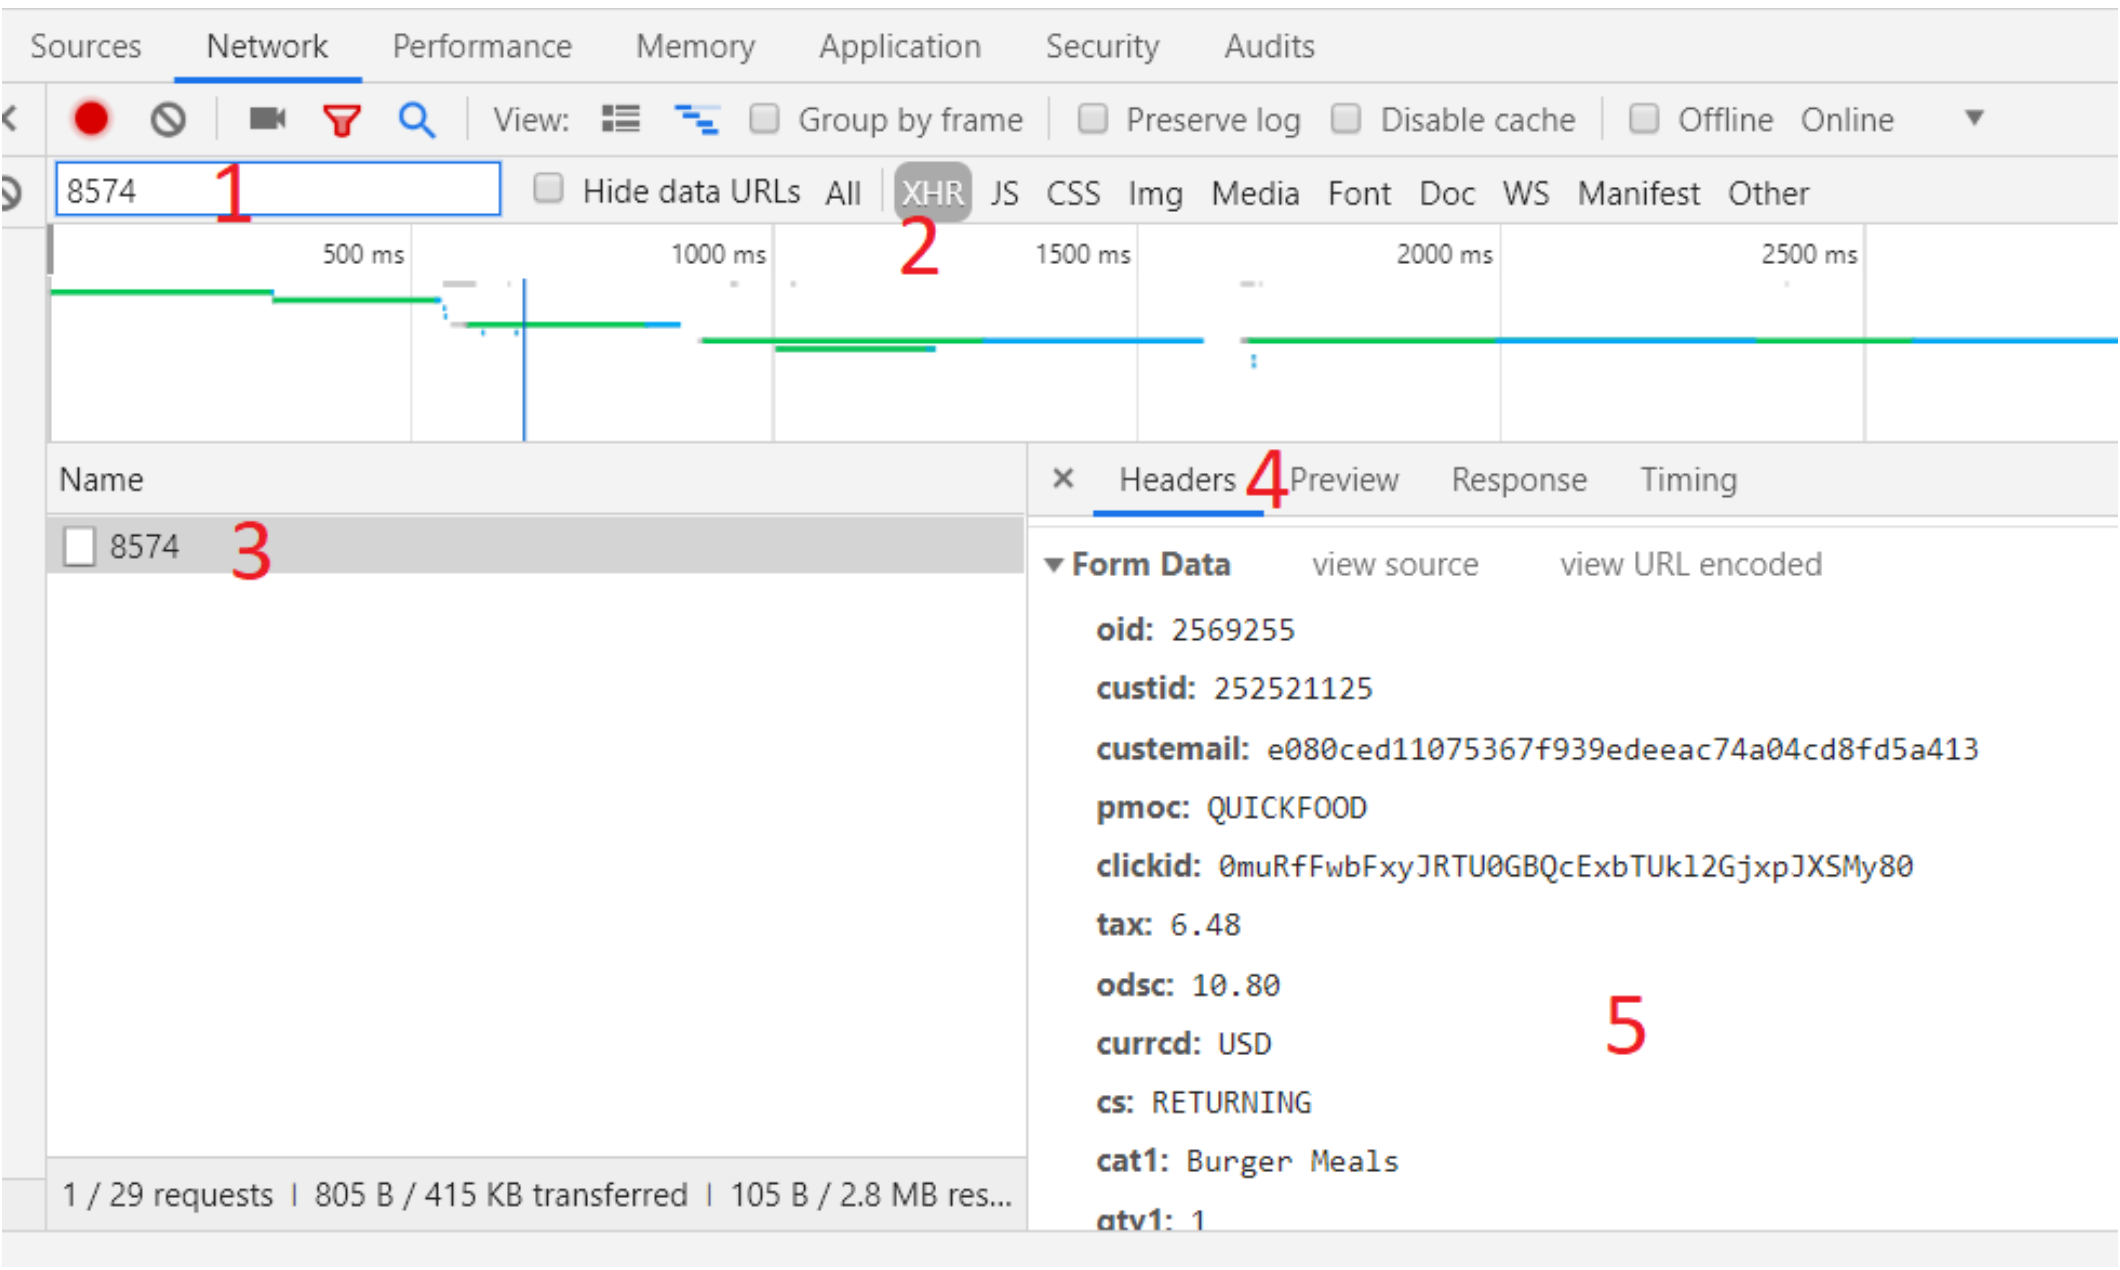
- A good way to test the conversion tracking tag, is to select the Network tab of the browser developer tools.
- Input your impact.com Program ID (formerly Campaign ID) in the filter field. Look at the list of Program IDs being populated under the Name field.
There should be two Program IDs listed below one another. One is the impact.com Identify function firing, and the other is the impact.com Conversion Tracking Tag, (normally first in the list and the only one with the XHR and fetch method).
If theIR_PIcookie already exists in the browser, the identify function will not show up in the network tab.- Select the impact.com Program ID on the left then look at the headers and request payload on the right. The item and order level details should be visible in the conversion tracking details.
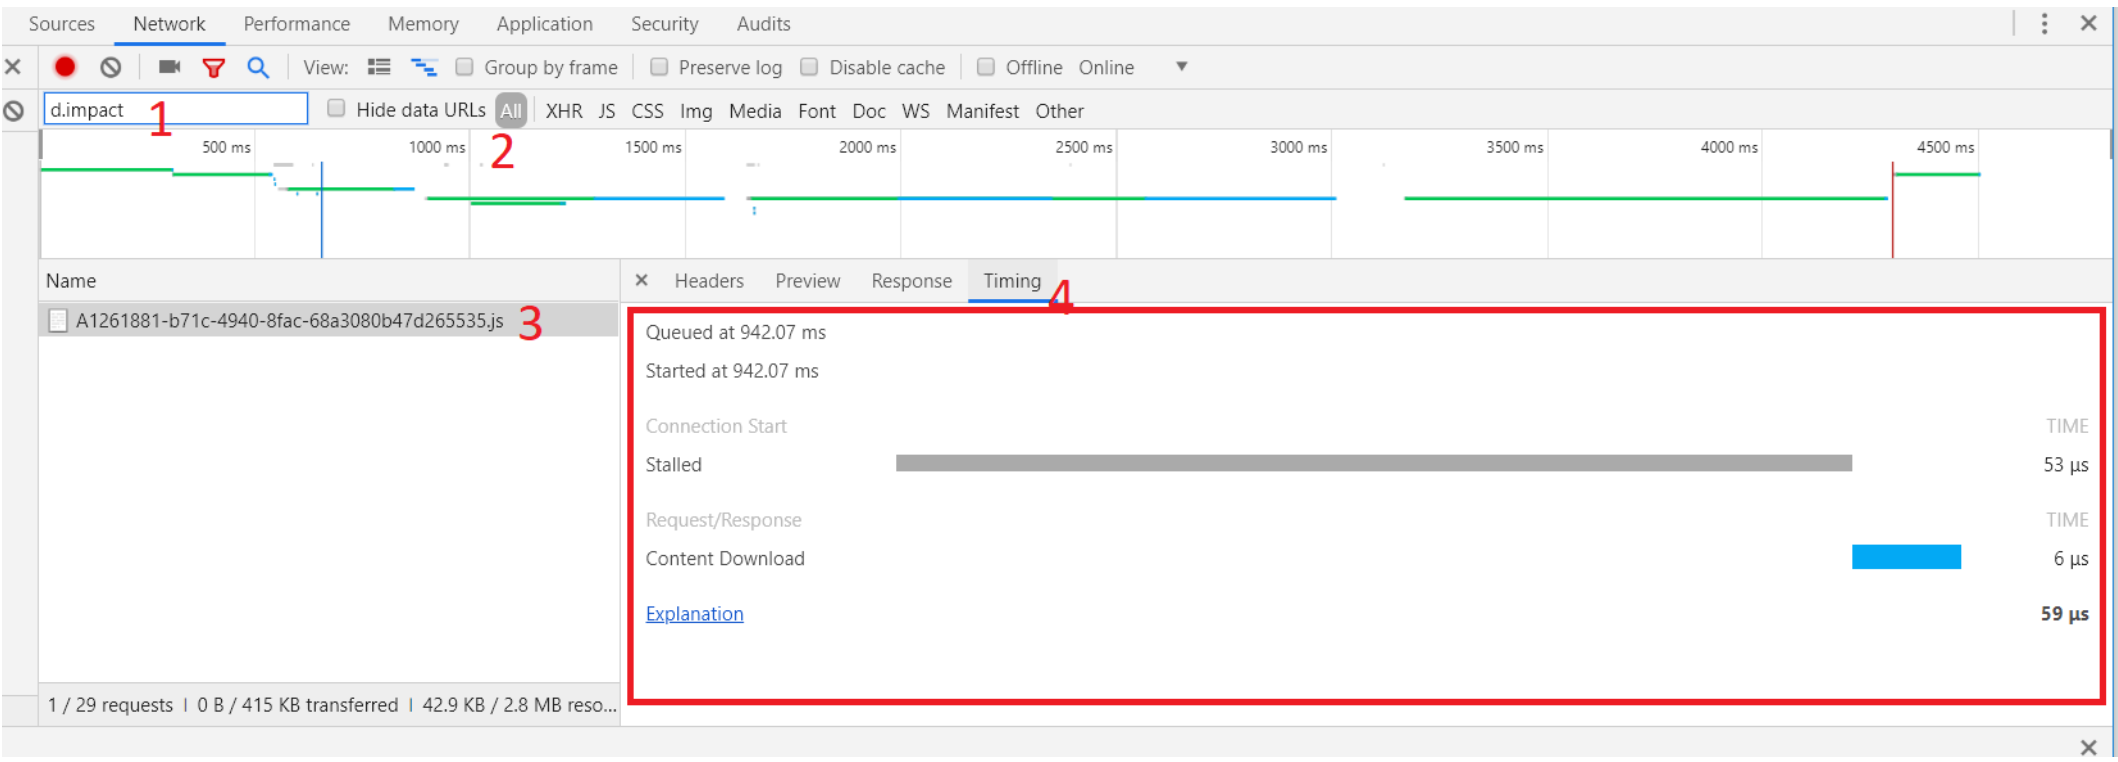
- It is recommended that the impact.com UTT’s load time is under 3 seconds. To test this, remove the impact.com Program IDs from the filter field and replace it with
d.impactorimpactcdndepending on your version of UTT. - Ensure the request method is set to All.
- Select the impact.com conversion tracking tag under the Name field.
- Navigate to the Timing tab, under the payloads section.
- View the timing summary in bold at the right under the different waterfalls. It should be under 7 seconds.
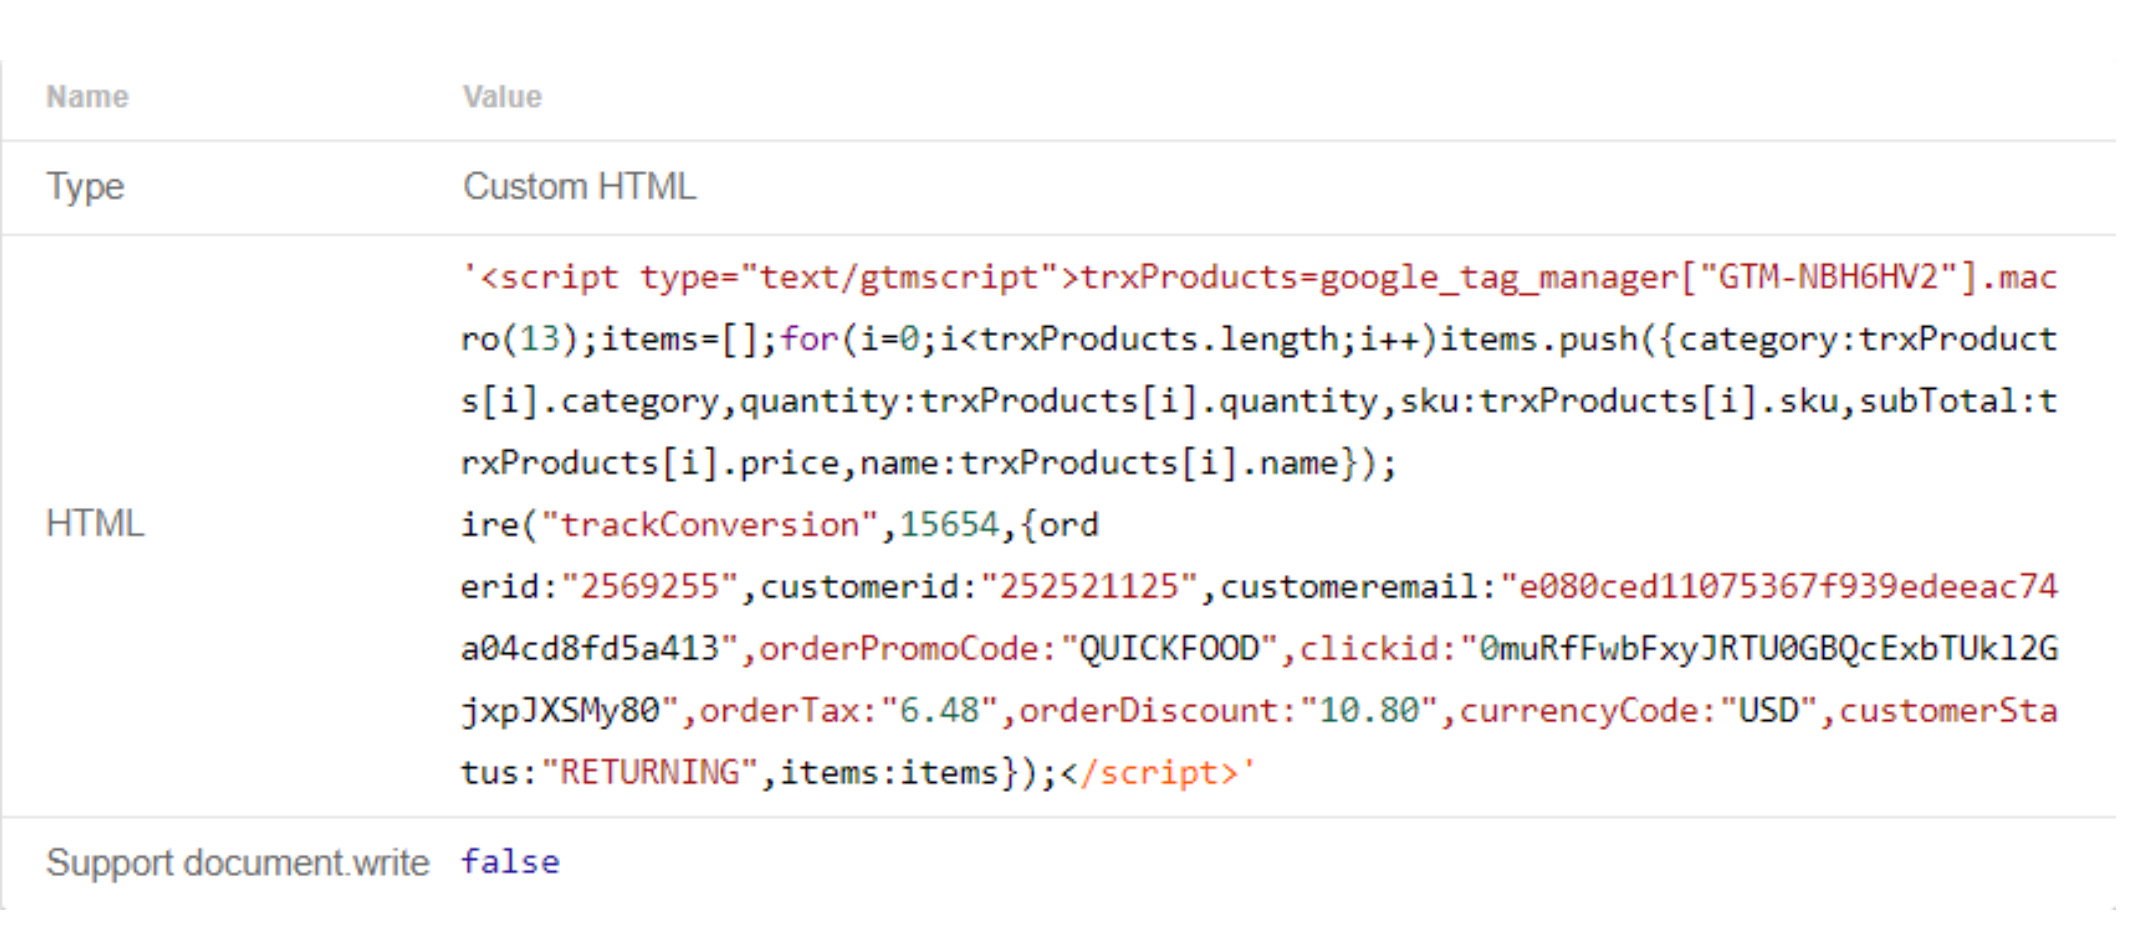
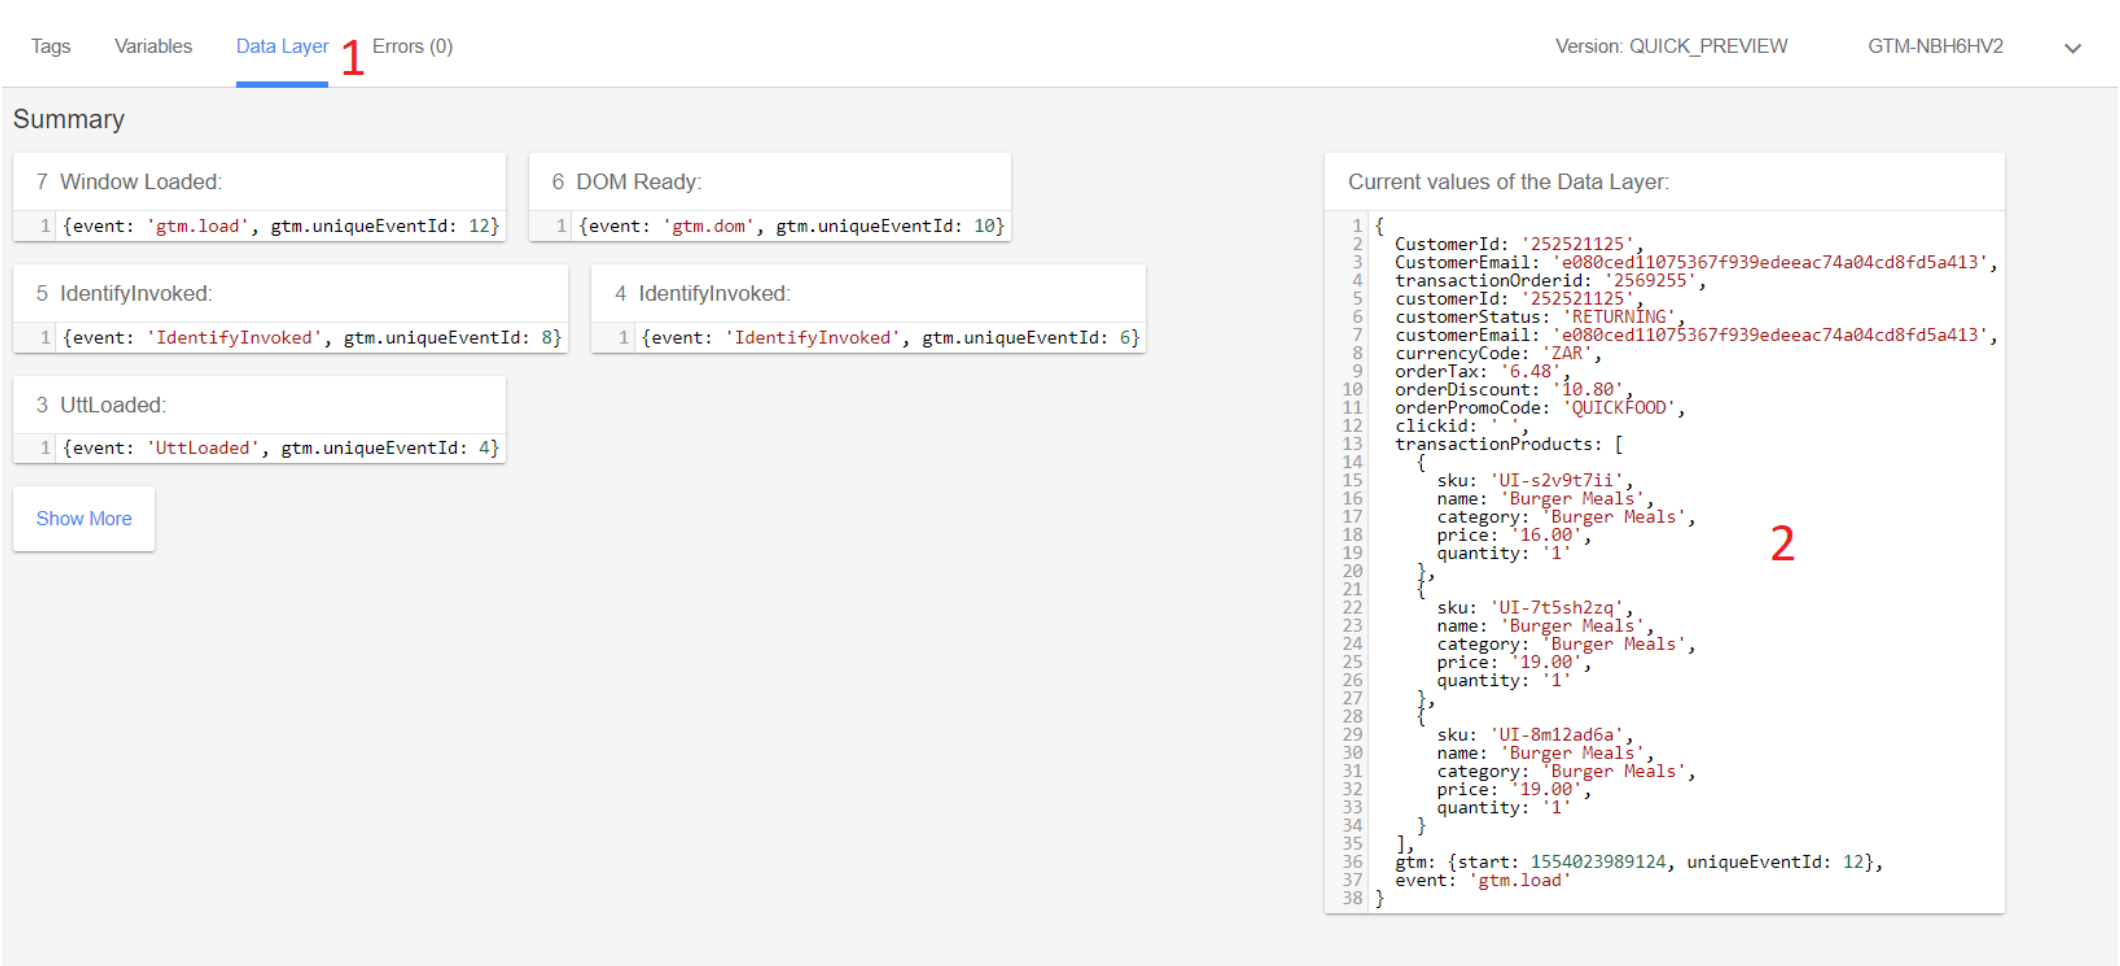
NoteTo test if the items array is empty, select the Data Layer tab at the top of the GTM Console. Next, inspect your Data Layer. View the data layer order level details and item level details to confirm if the fields are populated.
Preview your changes and test further
- Select Preview in your GTM container and navigate to your page where you have deployed your Conversion Tracking Tags.
- Complete a conversion. The first time the conversion tracking tags should fire.
- Ensure the browser developers tools console is open. After the initial checkout, all conversion tracking tags should fire.
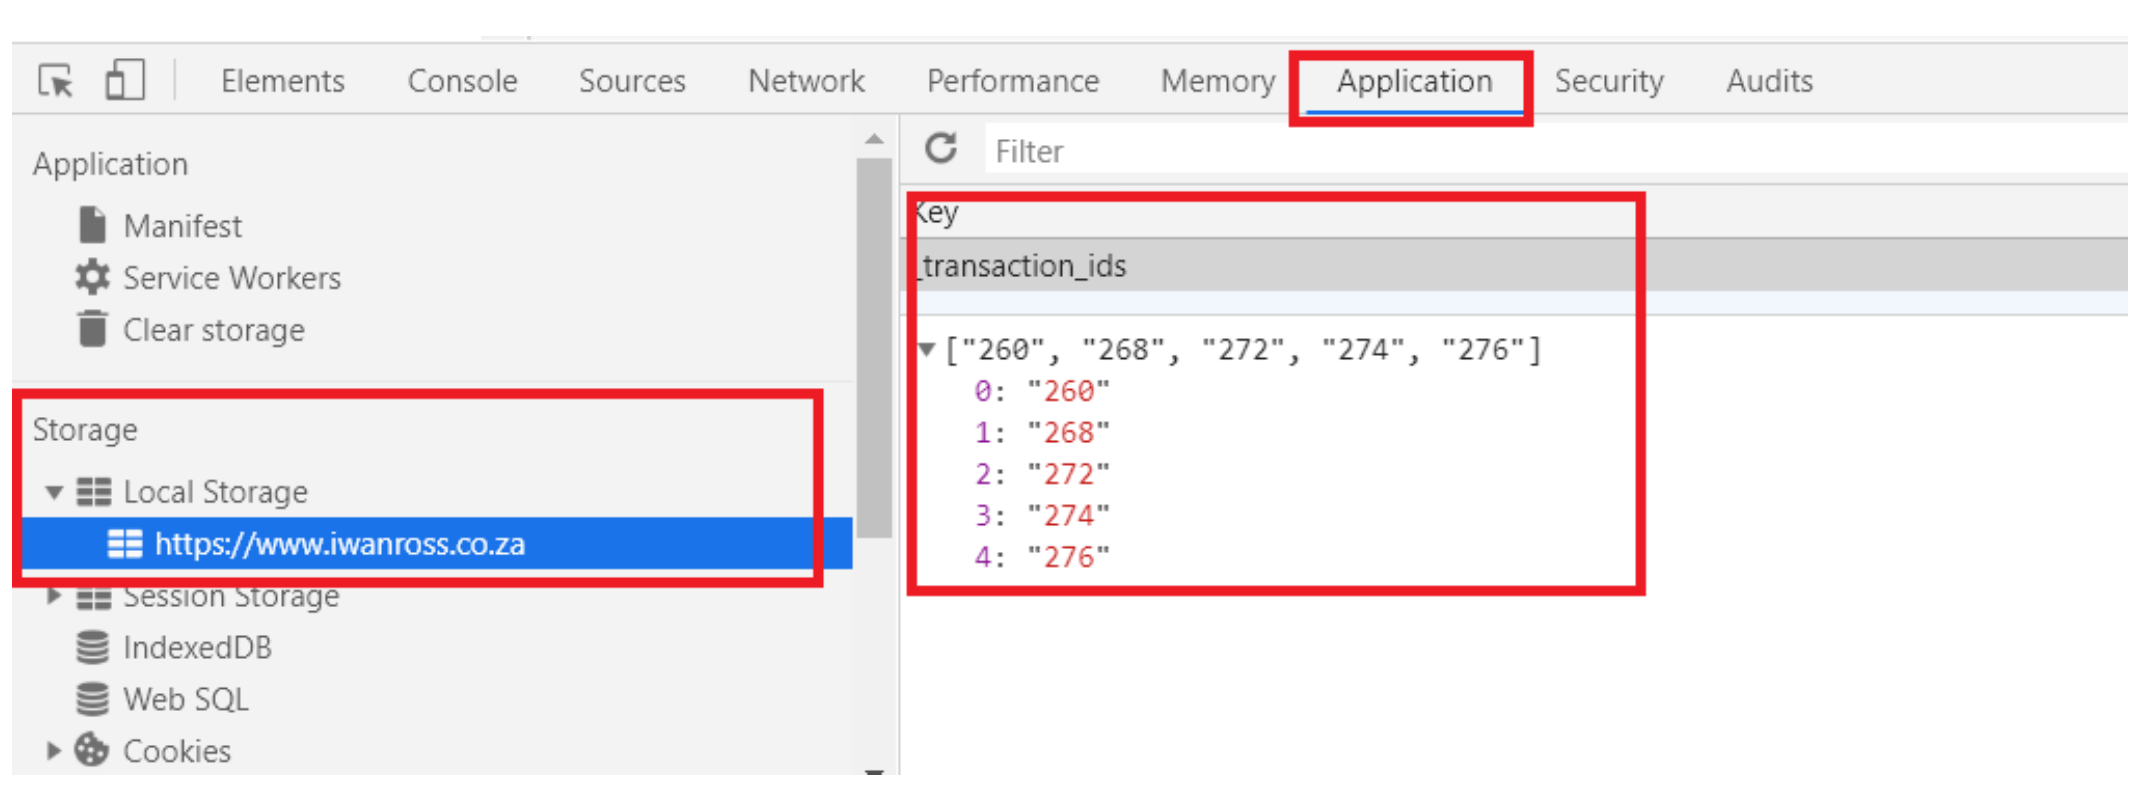
- From your browser developer tools, navigate to the Application tab, then select Storage → Local Storage → Domain Name.
- Find the
_transaction_idskey and verify that the Transaction Order ID is stored in the file. - Reload the confirmation page by using any preferred methods to refresh the page content. This time around, the conversion tracking tags should not fire.

Google Tag Manager Preview
Google Tag Manager’s (GTM) preview mode allows you to browse a site on which your container code is implemented as if the current container draft was deployed. This is so that you can test a container configuration before it is published. Sites with preview mode enabled will display a debug modal in the browser below the website content so that you can inspect which tags fired and in which order.
Step 1: Enable preview mode
To enable preview mode for your current workspace, select Preview. Tag manager will show a banner across the top of the workspace overview page to indicate that preview mode is active.
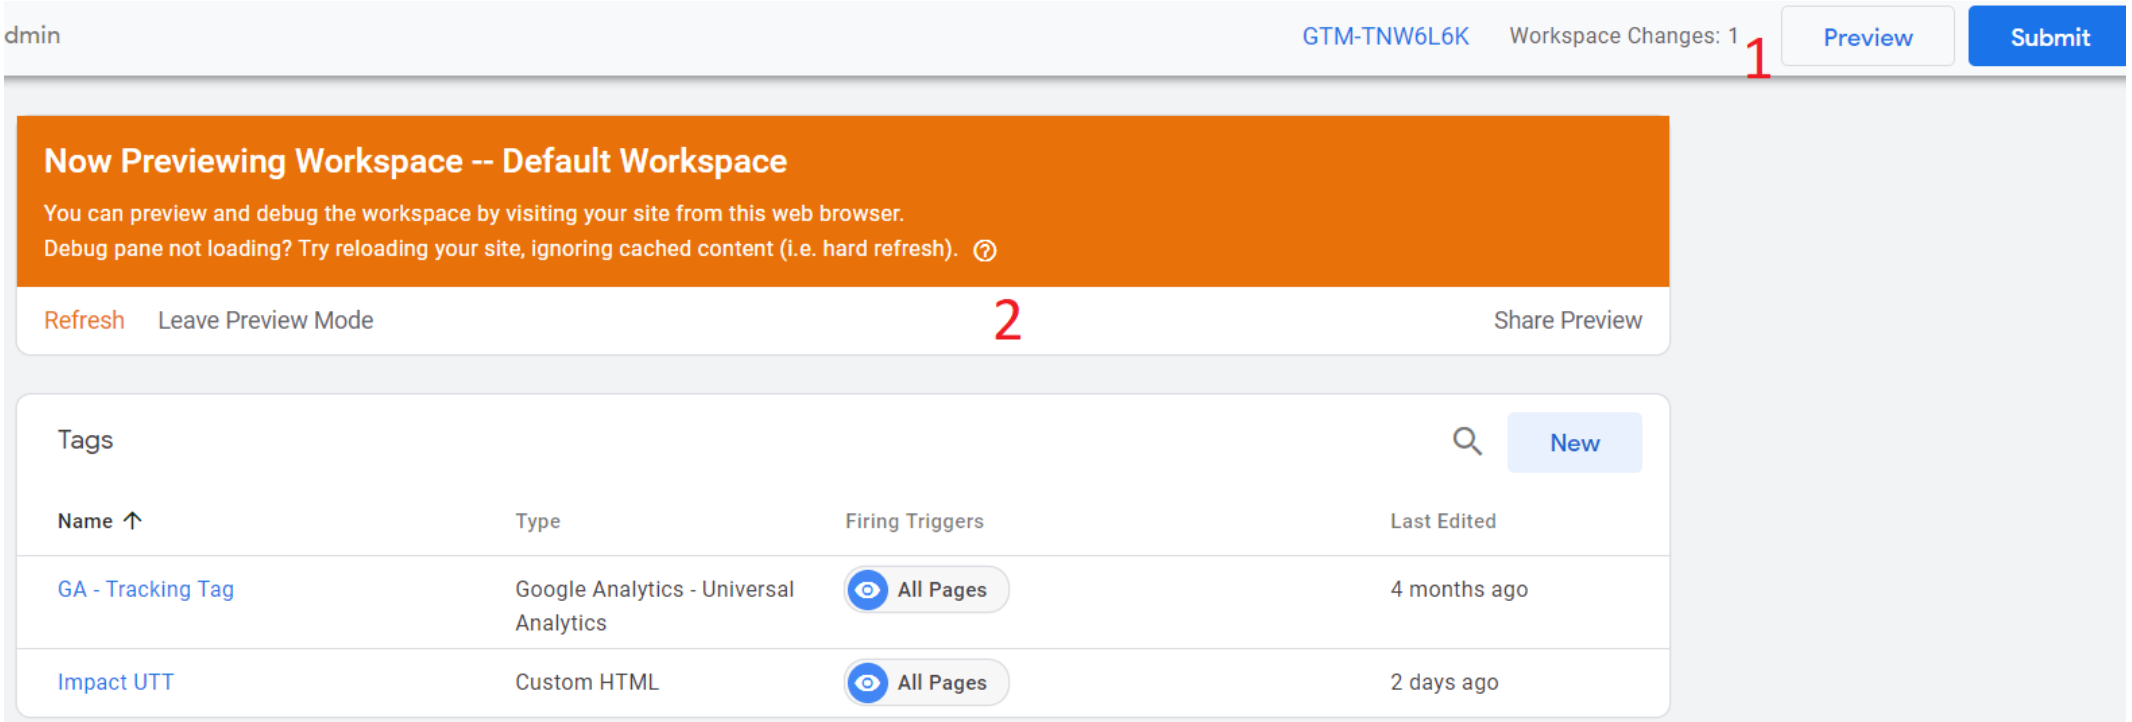
You can also preview any older version of a container. To preview a previous version of your container:
- In the left navigation, select Versions.
- Find the version you would like to work with and select Action → Preview.
Step 2: Use Preview Mode
Once preview mode is enabled, navigate to the site where the container is implemented and you will see a debug console window at the bottom of your browser. The debug console shows detailed information about your tags, including how tags fired and what data is being processed. The console window will appear only on the same browser that was used to enable preview mode, or for shared users, and is not visible to your regular website visitors.
If the debug modal does not load, try a forced refresh. This action will force the web browser to reload any cached assets. On Chrome, the keyboard shortcuts for a forced refresh are:
- Windows and Linux: Shift + F5 or Ctrl + Shift + r
- Mac: ⌘ + Shift + r
Use the information in the debug console to find out if tags and triggers fire properly and what data they pass to their respective services. As you click through your previewed website, the debug console will update information about how your tags are fired. You can use this information to see if a tag fired successfully, and what triggered (or did not trigger) its firing status.
The top navigation bar lists Tags, Variables, and the Data Layer. The left navigation bar shows a list of events.
- Tags: Select Tags to see which tags fired and which tags did not fire. Select a tag to view the tag's properties and associated triggers. When an event is selected in the left column, the Tags tab will show the status of tags for that event.
- Variables: The Variables tab will display detailed information about variables in the selected event, including the type of variable, the type of data returned, and the resolved value. Select an event in the left navigation to view the status of variables at the time the event fired.
- Data Layer: The Data Layer tab will show the exact message as it was pushed to the data layer for the selected event, and what the data layer looks like after the message transaction is complete. Select an event in the left navigation to view the status of the data layer at the time the event fired.

Step 3: Share Preview Mode
When preview mode is enabled, the previewed container configuration and debug pane are only visible from the same browser from where you activated preview mode. You can share this preview with others with a custom-generated URL. This feature is particularly handy if you would like to view the tags placed on a website.
To share or request a preview of a workspace configuration:
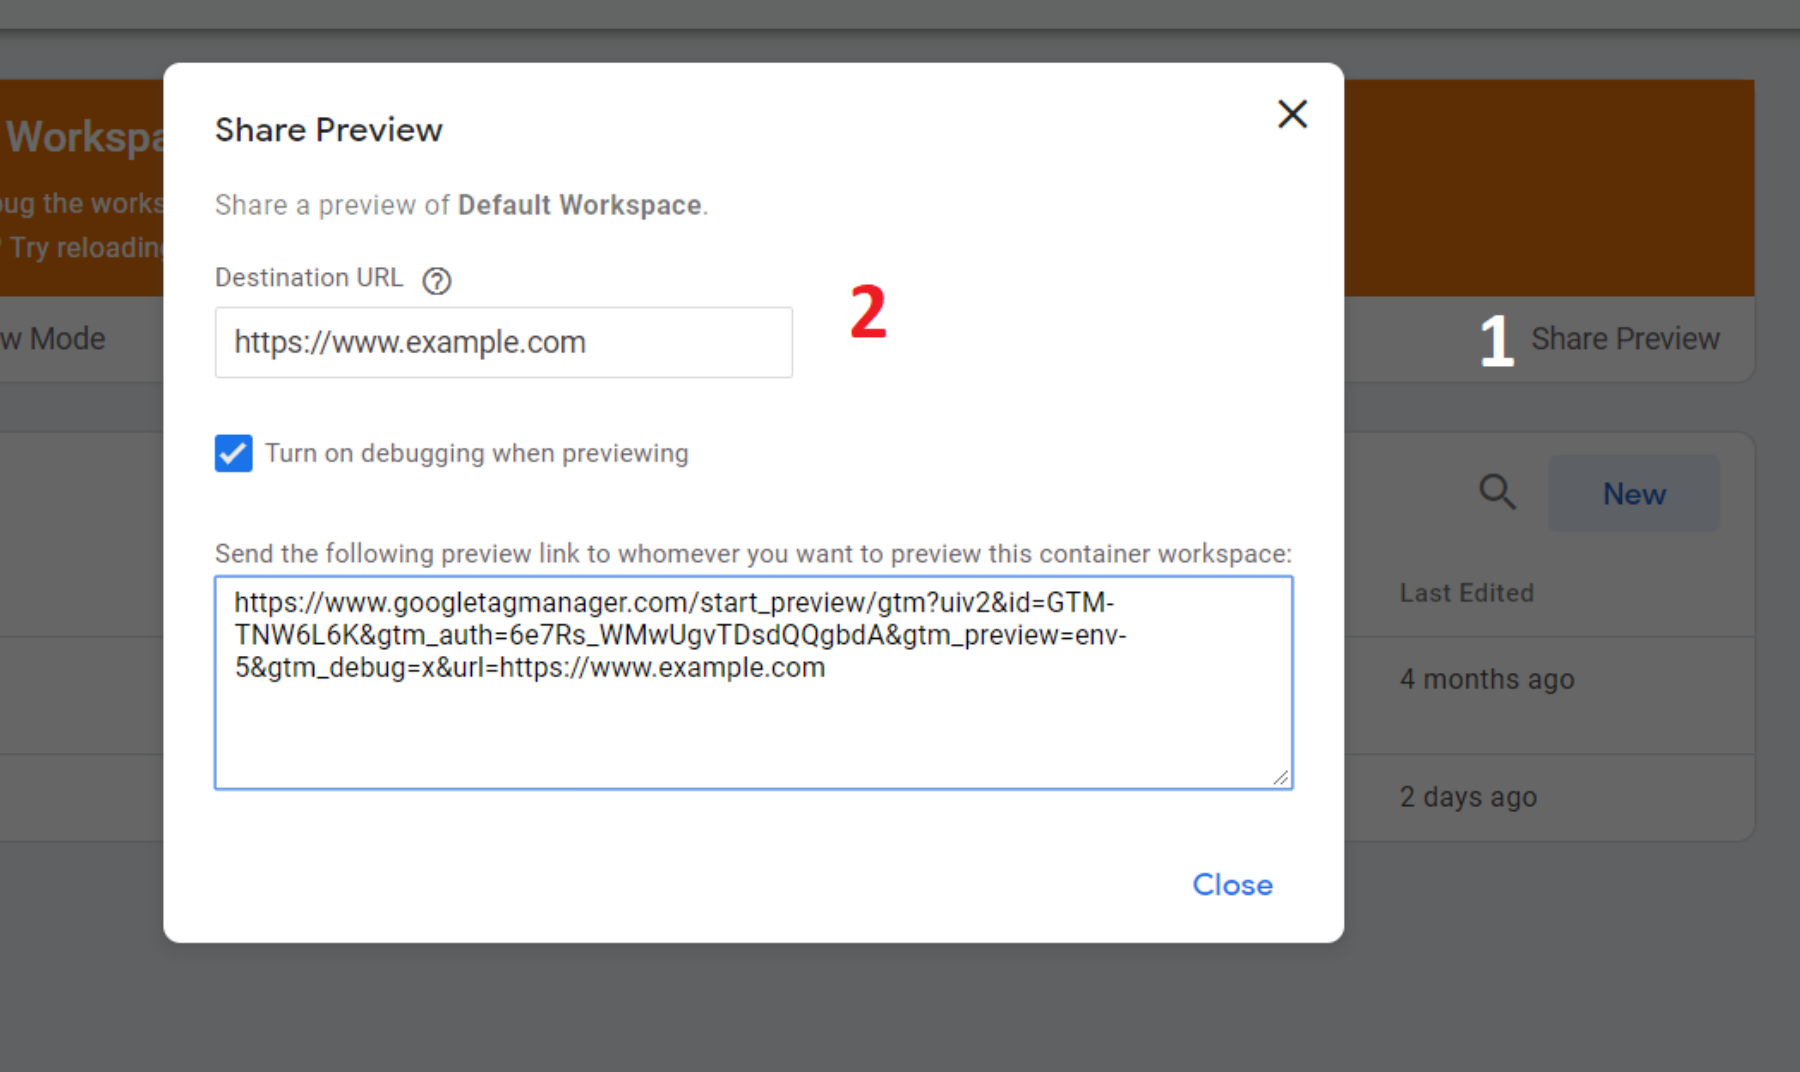
- Select Share Preview from the Preview Notification banner.
- In the Share Preview section, enter your target website domain (e.g. https://example.com/.)
- Copy the resulting preview URL from the indicated section.
- Paste the copied preview URL into an electronic message and send it to a colleague. The preview URL will take the user to a landing page where they will be informed that their browser has been enabled for preview mode.
Exit preview mode
To exit preview mode from your container:
- Select Workspace.
- Select Leave Preview Mode.
To exit a shared preview mode:
- Select the link received to go to the shared preview landing page.
- Select Exit preview and debug mode.

Updated 6 months ago
